Business
The Competitive World of Advertising: Online vs Traditional

Advertising has evolved into various forms since the first-ever ad back in 1941. Fast-forward to 2021, the world of advertising has become more cutthroat than ever. Did you know that an average person encounters at least 6,000 to 10,000 advertisements a day? To make sure their ads leave a memorable impact on people, marketers prioritize a more personal approach. Here’s a comparison of traditional advertising statistics vs. online advertising statistics.
The Shift For 2021 Advertising
In this competitive age of advertising, it’s a race to see who makes the most conversions. Indeed, successful advertisements are measured in numbers. However, due to our ongoing battle with COVID-19, most people lean towards a “work from home” setting. This type of environment also applies to business owners as the majority jumps into the world of eCommerce.
Last year, due to our socially isolated lifestyle, industry leaders turned many physical experiences digital. Thanks to our advanced technology, the transition only took us a while. Eventually, we have online meetings, trade shows, concerts, digital seminars, and industry conferences. On the other hand, marketers widely embraced the shift to digital advertising.
Back in 2020, digital experiences were only intended as a temporary fix. However, it’s 2021, and the digital marketing trend is here to stay. Due to many people spending more time indoors, marketers and organizers saw a high level of engagement for digital advertising.
Here are four digital advertising trends to rule 2021:
- Moving images
- The year for micro-influencers
- Sentiment analysis by AI Platforms to target users
- Interactive content and advertising
Advertising Budget
In 2020, the pandemic has shaken our comfort zones and left us struggling to cope with the new normal. Due to this, some businesses benefited while some had their losses. Seeing the struggles of some businesses to stay afloat, everyone expected a decline in allocated funds such as marketing budgets. However, everyone expected wrong.
It turns out, the percentage for advertising costs surged to the highest level according to WebStrategies. Usually, the marketing spending percentage plays between 6.5% to 10%. In February 2020, when we’re still living our pre-COVID lives, the expected growth was 8.6%. Skipping to June 2020, the bars rose to a stunning 11.4 percent.
Now we’re months into 2021, and ad spending continues to grow in percentage. The continuous growth in expenditure is expected as the competition grows more fierce this year.
Online Advertising Statistics:


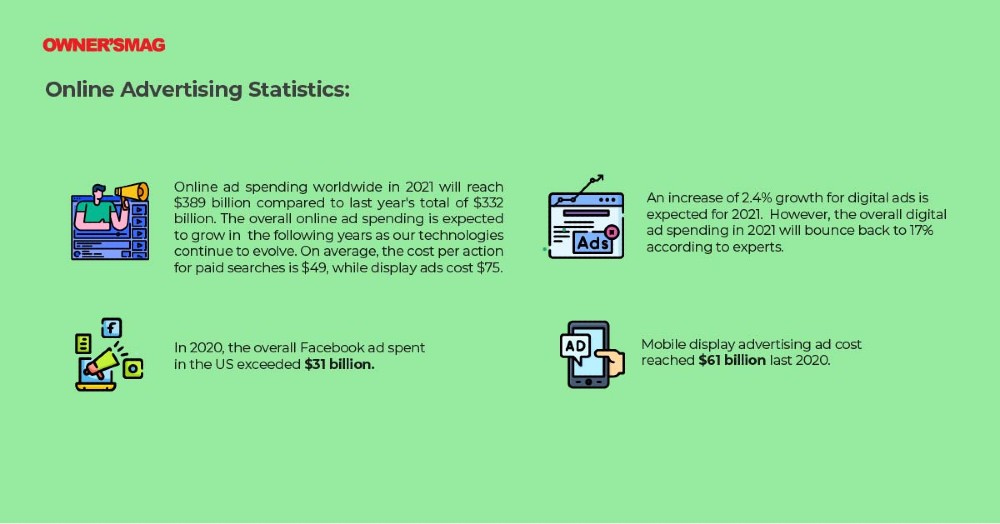


- Online ad spending worldwide in 2021 will reach $389 billion compared to last year’s total of $332 billion (eMarketer). The overall online ad spending is expected to grow in the following years as our technologies continue to evolve.
- On average, the cost per action for paid searches is $49, while display ads cost $75 (WordStream).
- An increase of 2.4% growth for digital ads is expected for 2021. However, the overall digital ad spending in 2021 will bounce back to 17% according to experts(eMarketer).
- In 2020, the overall Facebook ad spent in the US exceeded $31 billion.
- Mobile display advertising ad cost reached $61 billion last 2020.
Traditional Advertising Statistics:
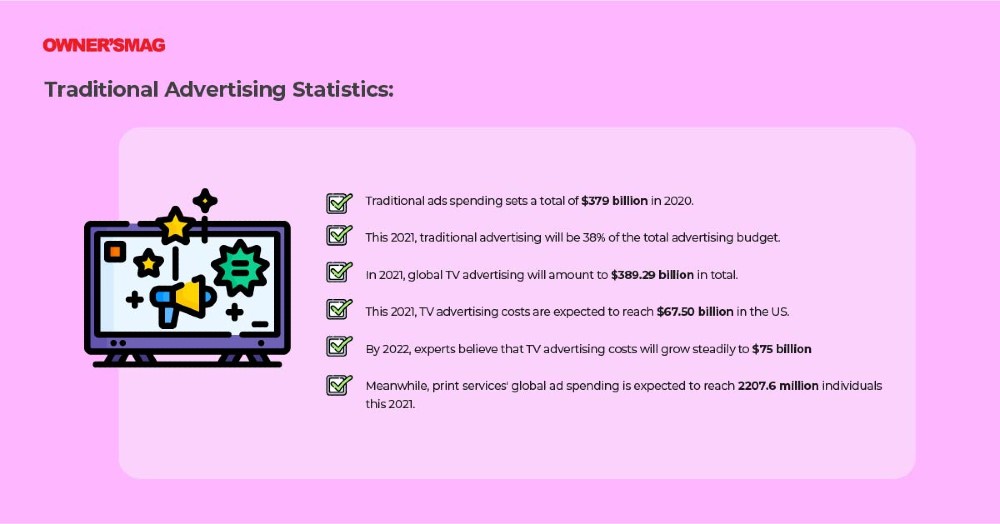
- Traditional ads spending sets a total of $379 billion in 2020 (eMarketer).
- This 2021, traditional advertising will be 38% of the total advertising budget (TechCrunch).
- In 2021, global TV advertising will amount to $389.29 billion in total (eMarketer).
- This 2021, TV advertising costs are expected to reach $67.50 billion in the US (eMarketer).
- By 2022, experts believe that TV advertising costs will grow steadily to $75 billion (MarketingCharts).
- Meanwhile, print services’ global ad spending is expected to reach 2207.6 million individuals this 2021 (SmallBizTrends).
- In 2021, marketers are expected to spend $44,173 million on global printing advertising (SmallBizTrends).
- By 2027, global outdoor advertising like a billboard is estimated to reach $53.5 billion (Report Linker).
Advertising Mediums
Online Advertising Statistics
Social Media
- In 2021, marketers are expected to spend over $50 billion on social media advertising (eMarketer).
- At least 73% of small businesses use social media advertising (Small Business Trends).
- 92% of seasoned marketers use Facebook as the primary platform for advertising (Invesp).
- As the king of social media platforms, Facebook contributes to a whopping 80.4% referral to eCommerce websites (eMarketer).
Digital Ads
- Globally, the experts foresee the display ad spend to hit $117 billion (Zenith).
- In 2021, internet display ads will be 21.3% of the total ad spend globally (Zenith).
- Internet users tend to look at original content and native ads at the same time (Sharethrough).
- Compared to standard display ads, native ads generate 52% more views (Sharethrough).
- An 18% lift in purchase intent is expected for native ads rather than banner ads (Sharethrough).
Google Ads
- Google has around 36.3% shares for digital Ad spending than other sites (eMarketer).
- At least 63% of internet users are likely to click on Google Ads (Clutch).
- The majority of internet users, at least 90%, see Google Ads (Google).
Video
- As the most popular video-sharing platform, Youtube has more than 2 billion active users monthly (SmallBizTrends).
- In 2021, an average person is expected to spend 1.6 hours per day watching online video content (Zenith).
- Worldwide online video consumers spend at least 8 hours watching content per week (Limelight Network).
Traditional Advertising Statistics
- A majority open 80% to 90% direct mail—meanwhile, 20% to 30% open ad emails (Small Business Trends).
- Adopting direct mail marketing is more effective than email marketing to target millennials (Small Business Trends).
- Magazine and Newspaper ads are the top two print advertising pillars in the industry.
Billboard
- Most of the time, at least 71% of people notice billboard ads. (Arbitron).
- After seeing billboard ads, 5 in 10 adults search online to research more about the product or service (Nielsen).
- 38% of people visited a Facebook page or approached the business via Facebook after seeing a billboard ad (Nielsen).
Conclusion
At the end of our online advertising statistics vs. traditional advertising statistics article, which type of advertising seems favorable to you? In the end, online advertising is the king for 2021. Let’s admit that the digital world is rapidly growing and evolving.
It’s one of the many reasons why marketers prioritize digital advertising. Besides, investing in online advertising gives way to a broader set of audiences and allows a brand to reach worldwide. However, utilizing both traditional and online ads is still the most effective way to reach customers.