Technology
What is a Gantt Chart Software for Project Management (with examples)

Whether you’re handling a small or big team, Gantt chart software is a tool that helps keep track of projects. Using one lets you keep an eye on a project’s status, start date, end date, and more. Read this ultimate guide on everything you need to know about Gantt chart tools.
History of Gantt Chart Software?


The Gantt chart was invented by American engineer and management consultant Henry Gantt in the early 20th century. Gantt pioneered scientific management, a philosophy that aimed to increase efficiency and productivity. He did this by applying scientific methods to the planning and control of work. He developed the Gantt chart to help managers visualize the tasks and schedules involved in a project.
The first Gantt charts were simple bar charts showing tasks’ start and end dates. However, the format has evolved to include more information and features. During World War I, Gantt charts were used to plan and control military production. After the war, they became widely used in industry for planning and overseeing construction, manufacturing, and other projects.
Today, this helpful tool is widely embraced within every workforce sector. Unfortunately, not a lot of employers and employees know what it is. We’ll break it down for you below.
What is a Gantt Chart Software?

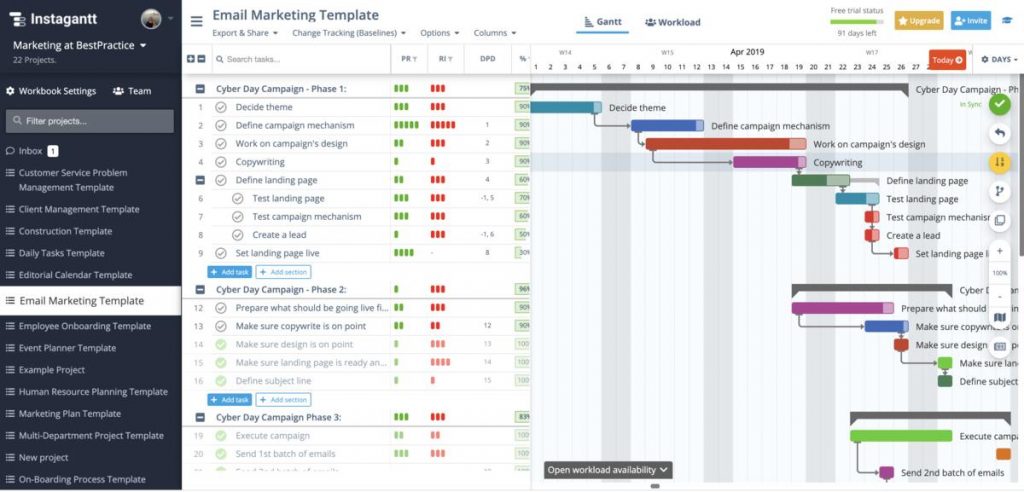
Image credit: Instagantt
A Gantt chart is a bar chart tool that displays the start and end dates of tasks, activities, or events within a project schedule. It’s a visual representation of a project plan that shows tasks and their durations as horizontal bars on a timeline. Each bar represents a different task. Each bar’s length corresponds to the task’s duration, and the bar’s position on the timeline shows the start and end dates.
Gantt charts are used in project management, providing a straightfoward overview of the project schedule. They are handy for showing the relationships between tasks and their dependencies. And these are represented by arrows connecting the bars.
For example, a task that must be completed before another task can start is shown as a predecessor. The chart can also display milestones, critical path analysis, and the status of tasks in real-time. Overall, this helps identify potential risks and delays.
Types of Information You Can See on a Gantt Chart Platform:
- Different types of projects
- Start and end dates
- The estimated timeframe from start to finish
- Current project costs
- Estimated project costs
- Completion percentage for every activity
- Task groupings and correlation to other activities
- Task dependencies
- Projects phases and milestones
7 Benefits of Using a Gantt Chart Tool in Project Management
Gantt chart software might just be your new best friend if you find it hard to keep track of tasks and projects. Here’s why:
- Schedule clarity: A Gantt chart provides a clear visual representation of project tasks and deadlines. This way, it’s easier for everyone involved in the project to understand the schedule.
- Resource allocation: The chart can help companies allocate resources efficiently and identify potential bottlenecks or overlaps in the schedule.
- Task tracking: A Gantt chart provides an easy way to track task progress and adjust the schedule if necessary.
- Improved collaboration: The chart can help team members see the interdependencies between tasks, facilitating collaboration and coordination.
- Better communication: The chart can be used to communicate project plans and schedules to stakeholders, ensuring everyone is on the same page.
- Effective resource planning: It enables managers to assess resource utilization and optimize allocation to increase efficiency and minimize waste.
- Project control: The chart provides a straightforward way to monitor progress and take corrective action as needed.
Which Industries Can Benefit from a Gantt Chart

These are just a few examples of how Gantt charts can be used in various industries and project types. The chart’s flexibility and ability to display task dependencies and schedules make it valuable in many different contexts.
Construction projects
Gantt charts are commonly used in construction projects to plan and track the progress of tasks such as site preparation, excavation, framing, electrical and plumbing work, and finishing.
Software development
In software development, Gantt charts can be used to plan and track the development process, including coding, testing, debugging, and release tasks.
Event planning
Gantt charts are helpful in event planning to manage tasks such as venue selection, vendor selection, guest list management, and logistics.
Marketing campaigns
Gantt charts can help plan and track marketing campaigns, including research, planning, execution, and analysis.
Film production
In film production, Gantt charts are used to plan and track tasks such as pre-production, filming, post-production, and distribution.
Manufacturing
Gantt charts can be used in manufacturing to plan and track production processes, including design, prototyping, mass production, and quality control.
Research projects
In research projects, Gantt charts can be used to plan and track tasks such as data collection, analysis, and report writing.
Website design and development
In website design and development, Gantt charts can be used to plan and track layout, coding, testing, and deployment tasks.
5 Top Gantt Chart Software Programs
Here are five Gantt Chart Programs that can help you with project management:
1. InstaGantt
Instagantt is a user-friendly Gantt chart tool that helps teams plan, track and visualize their projects. It’s easy to use, with features such as drag-and-drop task scheduling, real-time collaboration, and automatic rescheduling. Instagantt also offers integrations with other tools, such as Trello, Asana, and Google Drive, making it easy to use alongside other project management tools.
2. TeamGantt
TeamGantt is designed for small to medium-sized businesses, teams, and individuals who need a simple yet powerful way to manage their projects. With TeamGantt, teams can easily create, edit, and share project plans, improving collaboration, communication, and project success rates for free!
3. Wrike
Wrike differentiates itself from other Gantt chart tools by offering a comprehensive project management solution that includes multiple features and tools to help teams plan, execute, and deliver projects successfully.
4. GanttPRO
GanttPRO is a versatile and robust tool that offers a user-friendly interface, making it easy to create and manage projects. Plus, it provides reporting and export functionality, making it easy to share project plans and progress with stakeholders.
5. Smartsheet
Smartsheet provides automation capabilities, making it possible to automate repetitive tasks and improve efficiency. It also integrates with various other tools and platforms, such as Google Drive, Microsoft Teams, and Trello.