Business
The Latest 70 Graphic Design Statistics You Should Know About

Graphic design has played a massive part in today’s digital generation. As online businesses experience site traffic surges, a lot of owners pay close attention to graphic design. The influence of design on a brand is evident. Everyone is aware that on-point branding for businesses with appealing visuals encourages engagement from target audiences. However, to reap such benefits, companies must apply graphic design correctly to their branding. Hence, it’s essential to be up to date with the latest graphic design statistics and trends.
For this article, we’ll dive into the latest graphic design statistics that will help you with your creative planning.
The Graphic Design Industry


- Ibis World
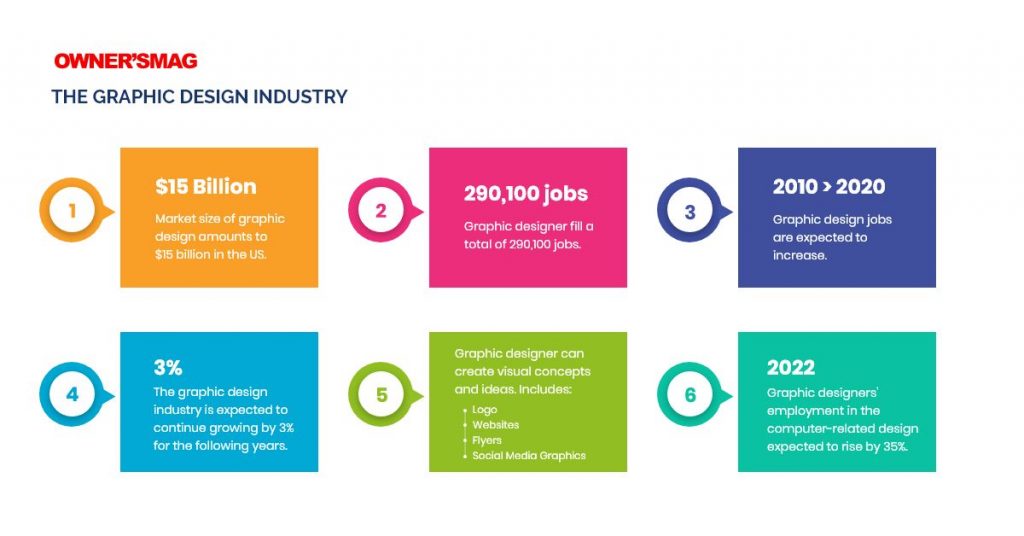
Currently, the market size of graphic design amounts to $15 billion in the US. Meanwhile, logo and branding design takes up a total of $3 billion in the market.
- College Grad
Graphic designers fill a total of 290,100 jobs.
- Chron
As per the Bureau of Labor Statistics, between 2010 to 2020, graphic design jobs are expected to increase. The industry is expected to remain competitive because of the high demand for the position.
- Bureau of Labor Statistics (BLS)
The graphic industry is expected to continue growing by 3% for the following years.
- BLS
According to BLS, a graphic designer can create visual concepts and ideas. This includes but not limited to the following:
- Logo
- Websites
- Flyers
- Social Media graphics
- SoftwareFindr
By 2022, graphic designers’ employment in the computer-related design and e-media field is expected to rise by 35%.
Career
- BLS
Bachelor’s degree is the typical entry-level education for graphic designers.
- BLS
For entry-level graphic designers, on-the-job training is minimal compared to other fields.
- Finances Online
Only one-third of 30% of graphic designers are employed in-house by companies and marketers.
- Finances Online
49% of marketers use graphic online tools and software for the non-designer.
- Finances Online
In the industry, only 10% of organizations hire freelance graphic designers.
- All Art Schools
After the first two years with a company, 40% of graphic designers leave the profession.
- Finances Online
While only 10% of organizations hire graphic designers, mostly 90% in the industry are freelancers.
- Brandon Gaille
Due to a highly competitive industry, a majority of designers are forced to broaden marketing and services. Some even include teaching at local universities.
- College Grad
In 2018 most of the graphic designers were:
- 22% self-employed
- 10% in specialized graphic design companies and services
- 8% in advertising
- 5% worked with publishers
Compensation
- Ibis World
The employment in the graphic design industry is 177,328.
- Ibis World
The average industry growth was 2.6% from the years 2015 to 2020.
- BLS
The average hourly rate for a graphic design service is $27.17. Annually, a graphic designer’s salary is $56,510.
- BLS
Meanwhile, graphic designers in the 90th percentile earn $42.89 per hour or $89 210 annually.
- Learn2G
The design categories in the graphic design industry are expected to grow by 24%
Rising Trends
- Digital Synopsis
In 2021, the majority of health and wellness brands will use muted color palettes. Mute colors have low saturation. Therefore, they bring a sense of safety and security.
- Digital Synopsis
A lot of designers are using geometric shapes and flat illustrations for social media’s graphic design. Besides that, people gravitate more towards futuristic and modern shapes.
- Digital Synopsis
The majority of people are looking for something “serious” for fonts. Therefore, classic fonts are widely popular.
- 99designs
85% of consumers are using multiple devices at the same time to surf the internet. It’s best to optimize your graphics or website for various devices.
- 99designs
In the past years, minimalist concepts took over the design industry. However, there’s a shift in the trends where a more personal and customized design is needed.
- Digital Synopsis
Videos that comprise mostly of text to communicate branding messages more effectively and creatively are gaining popularity.
Graphic Design Statistics: Business
- WebFX
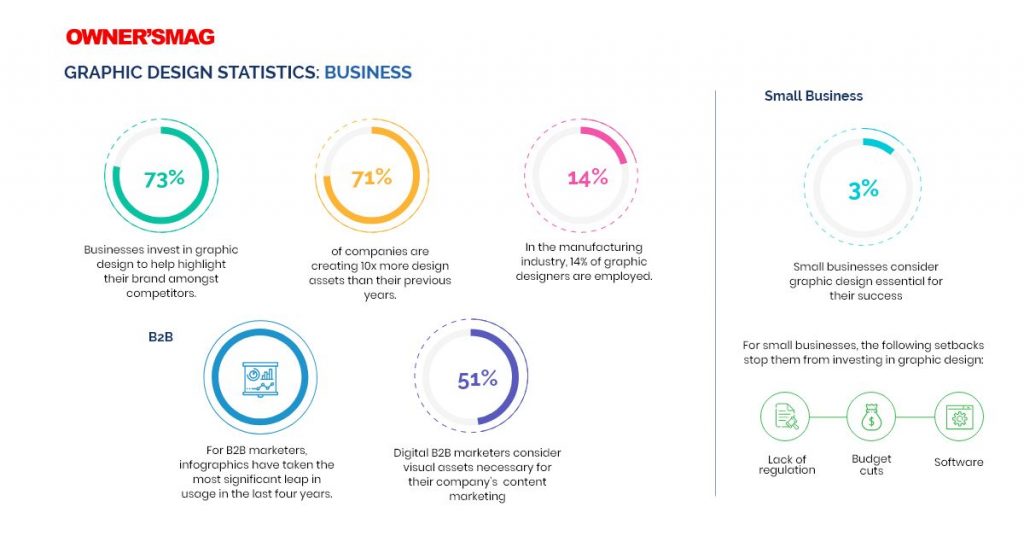
At least 73% of businesses invest in graphic design to help highlight their brand amongst competitors.
- Adobe
71% of companies are creating 10x more design assets than their previous years.
- SoftwareFindr
In the manufacturing industry, 14% of graphic designers are employed.
B2B
- Content Marketing Institute
For B2B marketers, infographics have taken the most significant leap in usage in the last four years.
- Social Media Examiner
51% of digital B2B marketers consider visual assets necessary for their company’s content marketing.
Small Business
- 99designs
The majority of small businesses consider graphic design essential for their success. Meanwhile, 3% believe that visuals are not necessary.
- Chron
For small businesses, the following setbacks stop them from investing in graphic design:
- Lack of regulation
- Budget cuts
- Software
- 99designs
Small businesses are reluctant to hire graphic designers because of cost. Therefore:
- 50% outsource design work or do it by themselves
- 21% hire freelancers
- 18% run crowd-sourced design contents through online platforms
- 7% work with design agencies
- SoftwareFindr
Meanwhile, at least 67% of small businesses are willing to invest $500 for a logo.
Costs
- Upwork
Freelance designers on UpWork have an average of $20-$50 per hour. Meanwhile, the average cost of a graphic designed on the platform is $45.
- Upwork
Businesses should expect additional fees for premium design projects, especially with a tight deadline.
- Freelancer
Depending on the design type, most graphic design agencies will cost $85 to $100 an hour.
- Business 2 Community
Some designers charge per project rather than a per-hour rate. However, the rate for project-based jobs depends on the client’s design requirements. For example:
- Logo design based on an existing template costs $150 to $450.
- A logo designed from scratch costs $500 to $2,000.
Consumer Behavior
- DIY
It takes 50 milliseconds for a person to assess things visually. Therefore, brands should leave a strong impression within milliseconds.
- T-Sciences
Our brain can process visuals 60,000 times faster than information written through words.
- Canva
At least 90% of the information transmitted to our brain is mainly visual.
- Canva
Meanwhile, 40% of the people respond to visual information better than text.
- Kissmetrics
Subconsciously, people make a mental judgment about a product within 90 seconds of the first impression. 90% of the assessment focuses entirely on a color scheme.
- Kissmetrics
The number one influencing factor for 92.6% purchase of people is the visual dimension.
- Neil Patel
42% of online shoppers base their opinion on a website’s overall design and functionality. Meanwhile, 52% of shoppers are most likely not to return if the design is not appealing.
Graphic Design Statistics: Business Branding
Color
- Crowdspring
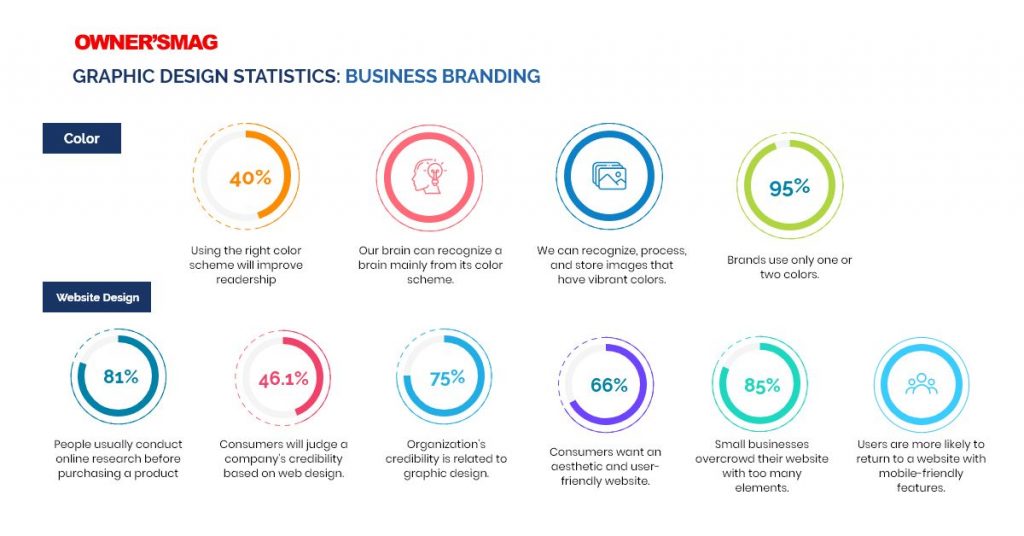
Using the right color scheme will improve readership by up to 40%.
- Crowdspring
Our brain can recognize a brain mainly from its color scheme.
- Color Com
We can recognize, process, and store images that have vibrant colors rather than black and white.
- Creative Market
95% of brands use only one or two colors. This makes it easier for people to recognize each brand.
Website Design
- DIY
81% of people usually conduct online research before purchasing a product.
- Hubspot
46.1% of the consumers will judge a company’s credibility based on web design.
- Hubspot
Overall, 75% of an organization’s credibility is related to graphic design.
- WebFX
66% of consumers want an aesthetic and user-friendly website.
- Good Firms
85% of small businesses overcrowd their website with too many elements. Overall, a tightly designed website is not pleasing to the eyes.
- WebFX
Users are more likely to return to a website with mobile-friendly features.
- WebFX
Consumers are most likely to exit slow-loading websites.
- WebFX
88% of users tend to spend more time on a web page with videos.
- WebFX
After receiving personalized content, 34% of consumers are most likely to make an impulse purchase.
Graphic Design Statistics: Marketing
- Venngage
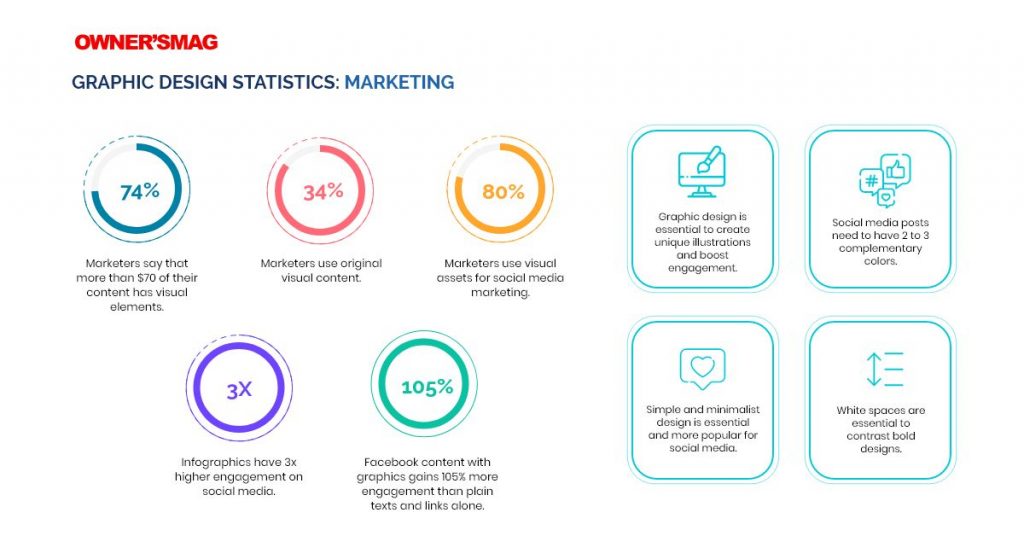
74% of marketers say that more than $70 of their content has visual elements.
- Venngage
34% of marketers use original graphics. A unique visual content was one of the most influential factors in helping them reach their marketing goals.
- Design Pickle
Graphic design is essential to create unique illustrations and boost engagement on your business’s social media.
- Social Media Examiner
At least 80% of marketers use visual assets for social media marketing.
- Social Media Today
Infographics have 3x higher engagement on social media.
- Social Media Today
Facebook content with graphics gains 105% more engagement than plain text and links alone.
- Design Pickle
Simple and minimalistic design is essential and more popular for social media. Be sure to use large images that have two font choices to emphasize keywords.
- Design Pickle
Social media posts need to have 2 to 3 complimentary colors.
- Design Pickle
White spaces are essential to contrast bold designs.
- Canva
Pinterest traffic can be increased by 62.5% with visually pleasing and relevant images to blog content.
- Demand Gen Report
Infographics increase web traffic by 12%.