Business
Top Advertising Statistics and Channels in 2021

Advertising in 2021 is certainly different compared to the previous years. Although traditional advertising still works, digital marketing is proving to be a marketer’s best friend in 2021. Why? Because digital advertising is more targeted and cost-efficient. The total ad spend for online advertising amounted to around $341 billion in 2020. This figure is slightly lower than the more expensive marketing counterpart, which is approximately $379 billion. This goes to show how much marketers are investing in online advertising. If you’re not convinced, here are the top online advertising statistics and channels in 2021.
PPC Advertising Statistics


Pay-per-click advertising will get your brands to scale quickly. Your customers will see your website and offers the moment they type their queries on search engines. These paid ads can also appear as banner ads on various websites. Here’s why you should invest in PPC advertising:
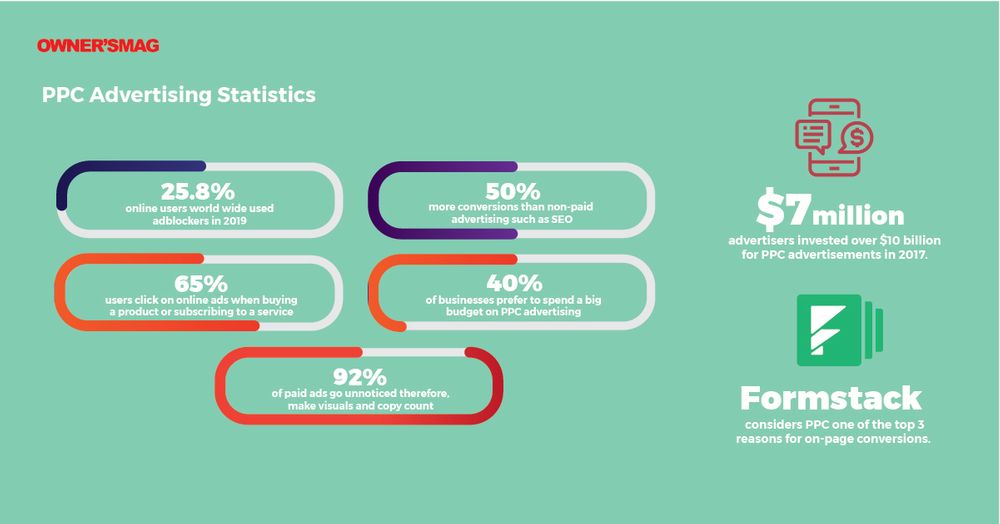
1. Social Media Today says there were around seven million advertisers who invested over $10 billion for PPC advertisements in 2017.
2. One of the primary hindrances in online ads is ad blockers. There were 25.8 percent of online users worldwide who used online ad blockers in 2019.
3. PPC is highly effective as Formstack considers PPC one of the top three reasons for on-page conversions.
4. According to Moz, traffic from PPC can offer advertisers 50 percent more conversions than non-paid advertising such as SEO.
5. WordLead says 65 percent of users click on online ads when buying a product or subscribing to a service.
6. It’s no surprise why more and more marketers use PPC advertising. Over 40 percent of businesses prefer to spend a big budget on PPC advertising.
7. Unfortunately, users don’t notice 92 percent of paid advertisements, according to KOL. Therefore, make the visuals and copy count.
SEO Advertising Statistics
SEO or Search Engine Optimization is also another effective digital marketing strategy. The upper hand of setting up SEO marketing is its cost-efficiency. Take note of these SEO advertising statistics:
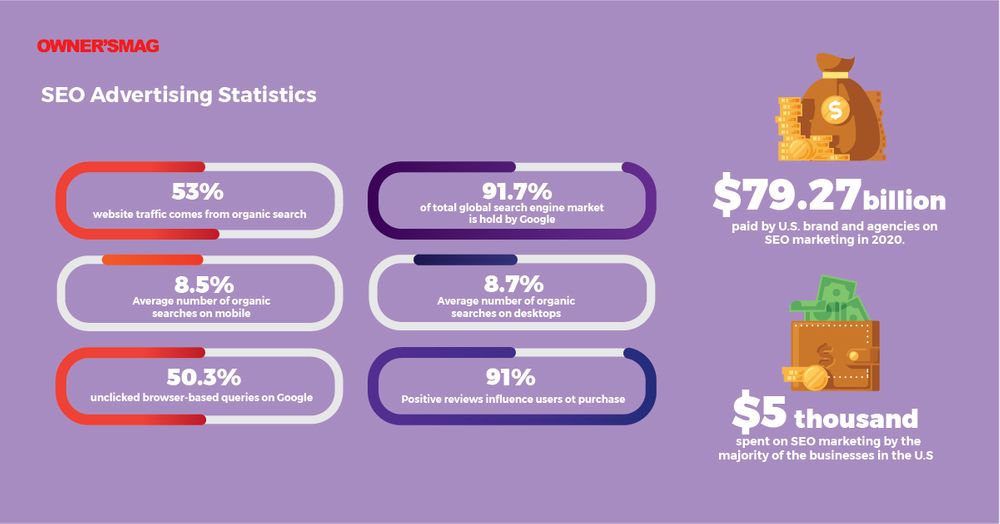
1. 53 percent of the website traffic comes from organic search.
2. Google holds 91.75 percent of the total global search engine market. It’s no surprise why Google is an Omnipotent channel!
3. The average number of organic searches on mobile is 8.5 percent. These searches can be found on the first pages. On the other hand, the average number of organic searches on desktops is 8.7 percent.
4. According to Borrell Associates, U.S. brands and agencies paid around $79.27 billion on SEO marketing in 2020.
5. Majority of the businesses in the U.S. are spending over $5,000 on SEO marketing.
6. If you provide relevance and value, your content won’t be one of the 90.63 percent of web pages that don’t get organic traffic.
7. There was 50.3 percent of browser-based queries on Google that didn’t get any clicks.
8. Leverage positive reviews on your organic content as 91 percent of users say positive reviews influence them to purchase.
Social Media Advertising Statistics
Social media advertising is undeniably expected in every online advertiser’s arsenal right now. If you’re not leveraging social media marketing, then your brand is missing out. Here are some social media advertising statistics worth looking into:
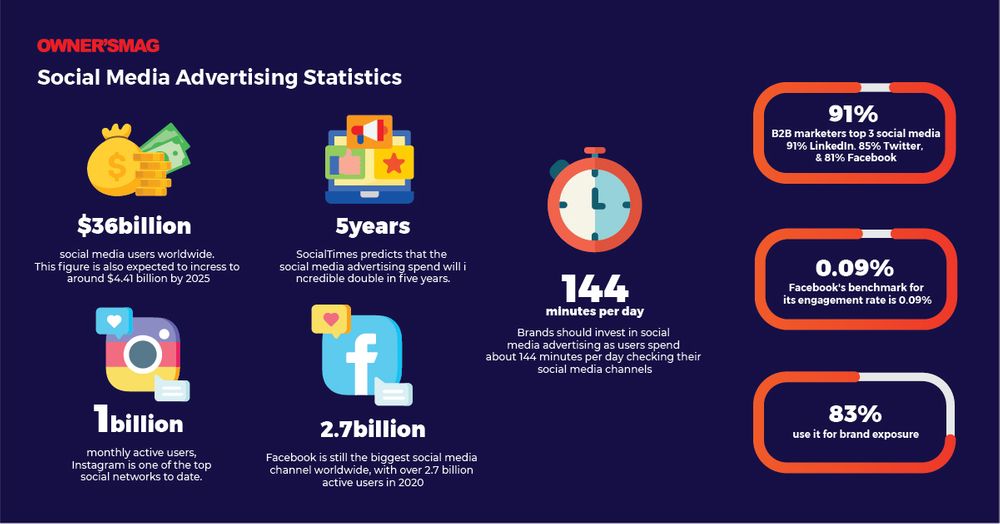
1. There are over 3.6 billion social media users worldwide. This figure is also expected to increase to around $4.41 billion by 2025.
2. SocialTimes predicts that the social media advertising spend will incredible double in five years.
3. B2B marketers admit that the top three social media channels they use for promoting their products and services are LinkedIn at 91 percent, Twitter at 85 percent, and Facebook at 81 percent.
4. When advertising on social media, advertisers aim for different goals. 83 percent use it for brand exposure, 65 percent for market insights, and 69 percent to increase website traffic.
5. Facebook is still the biggest social media channel worldwide, with over 2.7 billion active users in 2020.
6. Facebook’s benchmark for its engagement rate is 0.09 percent for every post across all industries.
7. With over one billion monthly active users, Instagram is one of the top social networks to date. Five hundred million of those users are actively using I.G. Stories.
8. Brands should invest in social media advertising as users spend about 144 minutes per day checking their social media channels.
9. One social media platform that you may overlook is Reddit. In December 2020, Reddit reported they have over 50+ million users daily. With that said, you can reach a wide range of users on the platform.
Email Advertising Statistics

Email is another personalized marketing tactic that can foster customer relationships and increase conversions. Through A/B testing and email segmentation, advertisers can maximize their email marketing efforts. Check out these email advertising statistics:
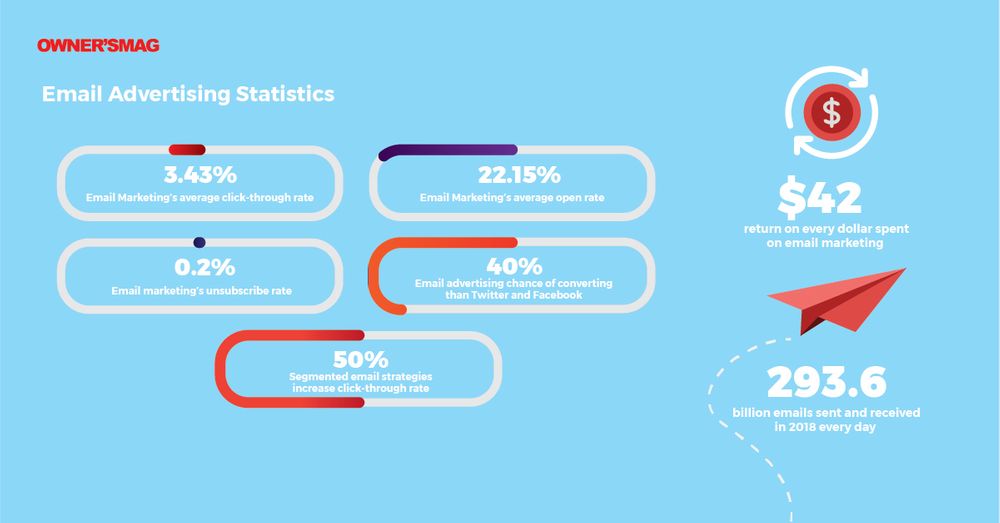
1. There were about 293.6 billion emails sent and received in 2018 every day.
2. Email marketing’s average click-through rate is 3.43 percent.
3. Email marketing’s average open rate was 22.15 percent.
4. In 2019, email marketing’s unsubscribe rate was 0.2 percent.
5. Email advertising has a 42-dollar return on every dollar spent.
6. Email advertising has a 40-percent chance of converting than Twitter and Facebook.
7. Segmented email strategies prove it increases click-through rates by 50 percent.
Content Marketing Statistics
Content Marketing is excellent when you want to educate and foster customer relationships. This strategy is also effective in gaining more followers and conversions. Provided that you complement content with killer visuals, you’ll likely soar your brand through content marketing. These advertising statistics should persuade you to create valuable content:
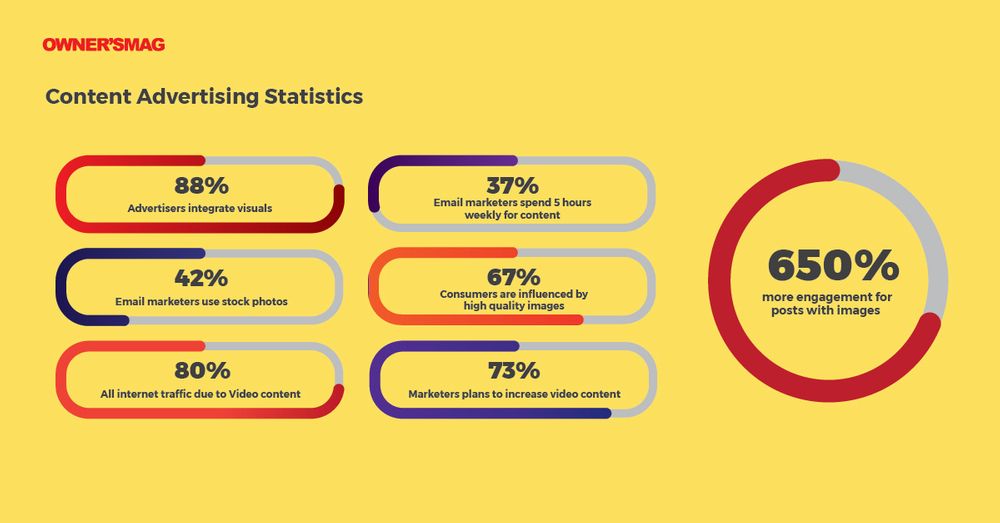
1. According to Venngage, 88 percent of advertisers integrate visuals in their content.
2. On average, 37 percent of email marketers spend up to five hours weekly planning and producing visual content.
3. Stock photos are used in some brands’ content, according to 42 percent of email marketers.
4. Posts with images garner up to 650 percent more engagement than posts without images.
5. 67 percent of consumers claim that high-quality images influence them to purchase. And this is why custom images done by the experts are recommended.
6. Video content reigned in 2020, acquiring 80 percent of all internet traffic.
7. In fact, 73 percent of marketers plan to increase their video content in their future marketing campaigns.
Brenda
July 1, 2023 at 12:13 pm
Thanks Kaytie, even in 2023 these links are very interesting. Best.